I’ve just had a Tado smart thermostat installed at home: it’s a clever device that controls the boiler, central heating and hot water and is linked to the internet. It has a room thermostat and takes account of the external temperature as well. You can control it from your smart phone or from the web app and, if you want, it will track your location so that when you leave the house it turns the temperature down and brings it up again in time for when you get home again.
I expect the web app and the mobile app are both in constant development and right now there are features only available in one or the other. For instance, you can only set the hot water schedule in the web app but can only see the historic temperature data in the mobile app (you have to turn your phone to landscape orientation to make it magically appear).
I wanted to see the historical temperature data on my computer instead of my phone so I had a poke around and have found a way to get hold of the data on one of my Raspberry Pis and send it to Loggly to graph it.
Getting data from Tado
The Tado API is not published (yet) and so what I write here may break unexpectedly if Tado change things. The slightly tricky part at the moment is authenticating with their system. I expect that when they do publish their API they will introduce an API key (a long secret series of letters and numbers for each user) but right now you need to authenticate with your username and password. In the web app, when you log in with your username and password your web browser gets sent a couple of session cookies to store which it then sends with subsequent requests so that it doesn’t need to send the username and password every time.
So, to log in, you need to do the following:
$ curl "https://my.tado.com/j_spring_security_check?j_password=yourPassword&[email protected]" --data-binary "{}" --cookie-jar /tmp/tadocookies
If you don’t have “curl” installed then just do sudo apt-get install curl first. Obviously, you need to replace “yourPassword” with your password and “[email protected]” with your email address that you use to log in to your Tado account. The information is sent over HTTPS so it is encrypted and no-one can see the password. The command does the login and saves the cookies that are sent back into the file /tmp/tadocookies. Let’s look at that file (I’ve obscured mine a little with a load of A’s here and there):
# Netscape HTTP Cookie File
# http://curl.haxx.se/rfc/cookie_spec.html
# This file was generated by libcurl! Edit at your own risk.

#HttpOnly_my.tado.com   FALSE   /       TRUE    0       JSESSIONID      AAAAAAAAAAAAAA64CF07EECF7E031450
my.tado.com     FALSE   /       FALSE   0       AWSELB  2AAAAAAAAAAAAAAAAAAAAAAAAAAAAA269D2CBB7352C49E5E7F7D538AAAAAAAAAAAAAAAAAAAAAAAAAAAAAECABD57B61651EC41095BC2AAAAAAAAAAAAAAAAAAAAAAAAA5E5474
In subsequent calls, this temporary secret cookie will be passed back to Tado to show who we are and that we have genuinely logged in.
The next thing to do is to find out what your home’s ID is:
The curl command just does an HTTP request to https://my.tado.com/api/v1/me, sets the Referer header (which for some reason the Tado system checks) and also sends the session cookies we stored in the authentication step. What is returned is in JSON, which I have formatted nicely below as an example:
{
        "name": "Your Name",
        "email": "[email protected]",
        "username": "[email protected]",
        "enabled": true,
        "homeId": 99999,
        "locale": "en_GB",
        "type": "WEB_USER"
}
The “homeId” is what you need to make a note of. In the subsequent calls I will just put “99999” but you need to replace it with your home ID. To get the current temperature data you need the following call:
$ curl "https://my.tado.com/api/v1/home/99999/hvacState" -H "Referer: https://my.tado.com/" --cookie /tmp/tadocookies
It will return some JSON data such as:
{
        "tadoMode": "HOME",
        "geolocationOverride": false,
        "setting": {
                "type": "HEATING",
                "power": "ON",
                "temperature": {
                        "celsius": 20,
                        "fahrenheit": 68
                }
        },
        "overlay": null,
        "insideTemperature": {
                "celsius": 19.98,
                "fahrenheit": 67.96,
                "timestamp": "2016-01-16T12:15:36.682Z",
                "type": "TEMPERATURE"
        },
        "humidity": {
                "type": "PERCENTAGE",
                "percentage": 53,
                "timestamp": "2016-01-16T12:15:36.682Z"
        }
}
The “tadoMode” is either “HOME”, “AWAY” or “SLEEP”. I don’t know what the “geolocationOverride” is. The “setting” part shows what the target temperature for the heating is set to. I don’t know what “overlay” is for. The “insideTemperature” and “humidity” are the values measured by the thermostat. Interestingly, the humidity is not reported in either the Tado mobile or web apps.
You can also get hold of the weather data that the Tado is using:
$ curl "https://my.tado.com/api/v1/home/99999/weather" -H "Referer: https://my.tado.com/" --cookie /tmp/tadocookies
That returns the following JSON:
{
        "solarIntensity": {
                "type": "PERCENTAGE",
                "percentage": 90,
                "timestamp": "2016-01-16T12:29:40.059Z"
        },
        "outsideTemperature": {
                "celsius": 2,
                "fahrenheit": 35.6,
                "timestamp": "2016-01-16T12:29:40.059Z",
                "type": "TEMPERATURE"
        },
        "weatherState": {
                "value": "SUN",
                "timestamp": "2016-01-15T12:39:59.467Z"
        }
}
Sending the data to Loggly
I already have a couple of my Raspberry Pis set up to send all their syslog data to Loggly. This is described in the Loggly documentation and in my previous posts on monitoring broadband speed and on general Raspberry Pi logging. Therefore all I have to do to get the data to Loggly is run the commands above and send the output to the syslog. To do this, make the following script in /usr/local/bin and call it tado:
#!/bin/sh

curl -s "https://my.tado.com/j_spring_security_check?j_password=yourPassword&[email protected]" --data-binary "{}" --cookie-jar /tmp/tadocookies
logger '{"tado":' `curl -s "https://my.tado.com/api/v1/home/99999/weather" -H "Referer: https://my.tado.com/" --cookie /tmp/tadocookies ` "}"
logger '{"tado":' `curl -s "https://my.tado.com/api/v1/home/99999/hvacState" -H "Referer: https://my.tado.com/" --cookie /tmp/tadocookies ` "}"
The script first does the authentication with your username and password and stores the session cookies. Session cookies only last a short time so we need to do it every time. The second and third lines include the curl commands we used above. I’ve changed them to be silent using the -s flag, otherwise they report on how long the request takes. The curl commands are surrounded by back-ticks which means the command is replaced by its output. The logger command goes at the front with a little bit more JSON. The logger command just puts whatever you want into the syslog (it appears in /var/log/messages by default). The curl commands return JSON as we saw above which is exactly what Loggly can deal with automatically. To make sure that the data is easy to find and doesn’t clash with any other data when it gets to Loggly I have just wrapped it in an additional “tado” element at the start and added the closing brace at the end.
Collecting the data regularly
We can get the script to run every 10 minutes by editing the system /etc/crontab file. You need to be root to edit it so do e.g. sudo vi /etc/crontab and add an extra line. Mine now looks like this:
# /etc/crontab: system-wide crontab
# Unlike any other crontab you don't have to run the `crontab'
# command to install the new version when you edit this file
# and files in /etc/cron.d. These files also have username fields,
# that none of the other crontabs do.

SHELL=/bin/sh
PATH=/usr/local/sbin:/usr/local/bin:/sbin:/bin:/usr/sbin:/usr/bin

# m h dom mon dow user  command
17 *    * * *   root    cd / && run-parts --report /etc/cron.hourly
25 6    * * *   root    test -x /usr/sbin/anacron || ( cd / && run-parts --report /etc/cron.daily )
47 6    * * 7   root    test -x /usr/sbin/anacron || ( cd / && run-parts --report /etc/cron.weekly )
52 6    1 * *   root    test -x /usr/sbin/anacron || ( cd / && run-parts --report /etc/cron.monthly )
*/10 * * * *    root    /usr/local/bin/tado
The extra line at the end says that the /usr/local/bin/tado script should be run as the root user every 10 minutes.
Viewing the data in Loggly
To view the data in Loggly, take the following steps (note that you have to do this in sequence as the interface changes each time you make a click):
- Click on the calendar icon and choose a time range such as the “last day”.
- Click on the “Search” button to load all the entries for the time range.
- Click on “JSON” in the list of the “Field Explorer” to focus on all JSON formatted data.
- Click on the metric you want to chart, such as “tado / insideTemperature / celsius”.
- Click on “Show Values Over Time” to plot the values of that metric on a time chart.
- You can then overlay additional data such as the set temperature or outside temperature by clicking on the plus icon.
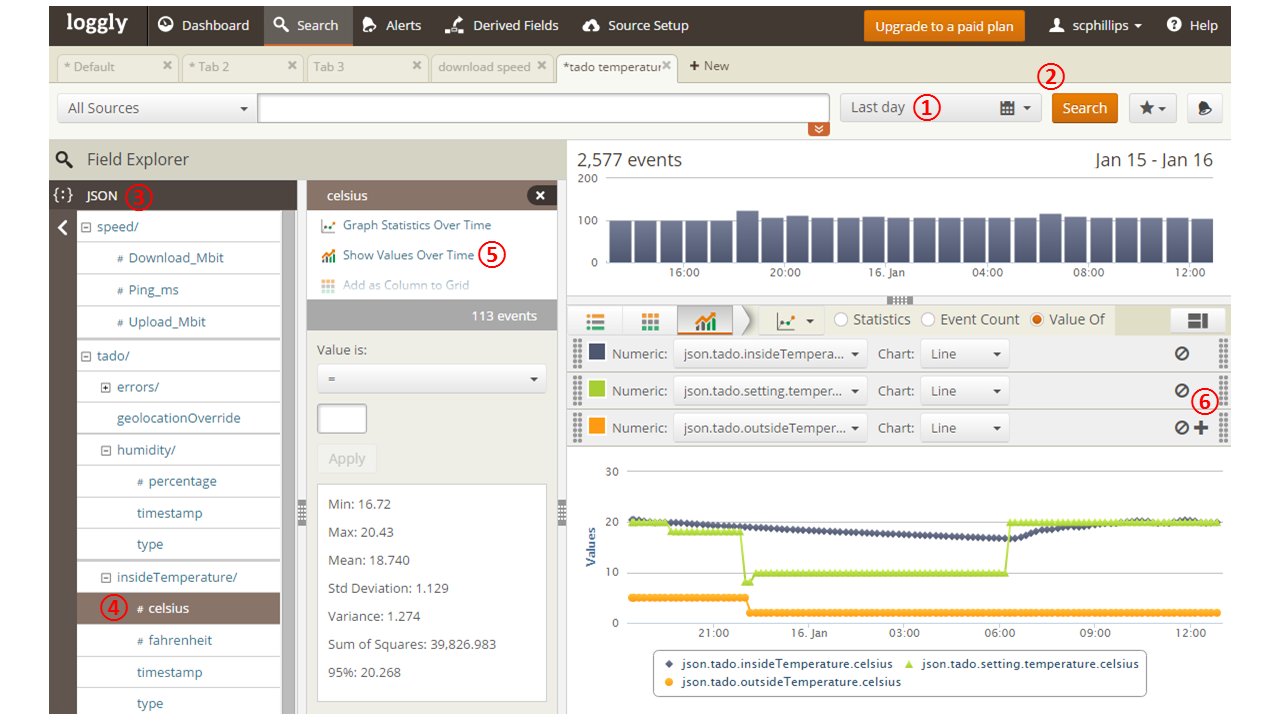
Steps to display the temperature chart in the Loggly dashboard.
You can then hover over the individual points to see the values or take note of the summary statistics shown such as the mean and standard deviation.
For data such as the weather state or the tado mode, you can only use e.g. the pie-chart graph and unfortunately can’t plot the values over time. For instance, the tado / tadoMode can be shown as:

Pie chart of the Tado mode
Viewing the data in the Tado app
In case you hadn’t worked it out, you can see similar graphs in the Tado smart-phone app itself but it’s not at all obvious how! What you have to do is open the app and then turn your phone or tablet into landscape mode. It will then pause while it loads the data for the current day. The chart I have right now is:
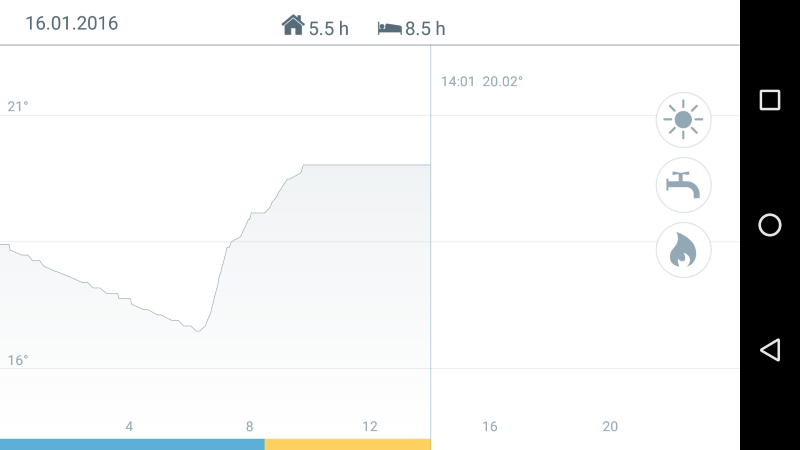
Screenshot of the temperature graph from the Tado mobile app
This hidden graph has various hidden features as well. You can:
- Press and hold on the flame button to highlight when the boiler was on.
- Press and hold on the tap button to show the times when it knew to make hot water available.
- Press and hold on the sun button to show when the sun was shining (for a while I thought this didn’t work but we were just having gloomy days!).
- Press and hold elsewhere on the graph and it will show you the exact time and temperature at a point.
- Swipe left or right to look at other days.
The colours along the bottom relate to the Tado modes which Loggly can only plot as a pie chart and not on a time axis. The occassional blob on the temperature graph shows where you have changed some setting or other.
Conclusion
The data from Tado is quite easy to get hold of already and I expect they will make a public API soon so that it is even easier. As it is formatted as JSON it is trivial to process it or send it straight over to services such as Loggly. You need to think carefully about what data you publish though. I am using a secure channel to send data to Loggly but I suppose there is still a small chance of a high-tech burglar hacking in and using the data to understand when we are home or not. It’s more likely that someone would notice that we’d all gone out through the traditional method of keeping an eye on the house though!

Comments
Comments powered by Disqus