Using Speedtest.net and Loggly to Monitor Broadband Speed
I’ve been having trouble with the speed of my network at home and needed to check whether the broadband link to the internet was working as fast as it should be. To check this, you really need to make many measurements over time, as at different times of the day the performance will vary depending on how many other people in the area are using the same link. To check the speed, I have plugged a spare Raspberry Pi directly into the my Virgin Media Superhub via an ethernet cable and set it up to measure and report the speed every hour. I’m sending the data to an online logging service called Loggly so that I can access it and graph it easily from any other computer.
The screenshot below shows the download speed for the last day.

Basic installation
I downloaded the latest version of Raspbian from the Raspberry Pi website (2015-02-16-raspbian-wheezy) and did the usual initial update steps:
We will also be needing to install a Python program, so pip is needed:
Loggly
Loggly is one of a few fairly new web services which allow you to send log data to them and help you display and interpret it. They are most useful for enterprises with lots of systems to monitor, but I am finding it very useful for small projects as well.
First you need to get a free account at Loggly. Once you have that, you can use various ways to send data to Loggly. The main way I have been doing it is to first configure my Pi to send a copy of all the system log (“syslog”) entries to Loggly and then log additional data to the syslog (which is then sent to Loggly) where I can filter it out from the rest and view it. This just seemed easiest, and it is quite useful sometimes to have the whole of the syslog available to look at as well. You can just send individual log events to Loggly using the REST API instead but that’s not what I’m doing here.
Your syslog is in /var/log/syslog. It stores information in time order from all the services running on the Raspberry Pi: it should be one of the first places to look if something is not working.
Loggly provide really good documentation, including how to set up syslog logging. The easiest way is to use their prepared script to configure things for you as described on that page. Once you have an account and you log in to the Loggly website it will even show you a command line with exactly the right data filled out and which uses a secure one-time token instead of your password. Log in, click on “Source setup” at the top and then “Linux” (for me the page is https://scphillips.loggly.com/sources/setup/linux but for you will have something different than scphillips).
You then need to do something like:
$ cd /tmp
$ curl -O https://www.loggly.com/install/configure-linux.sh
$ sudo bash configure-linux.sh -a <your-domain> -t <your-token> -u <your-username>
That’s changing to the tmp folder as we don’t need to keep the script, downloading the script with curl and then running it as root user with the necessary parameters for it to know who you are on Loggly (not generally recommended for random things you download, but I’ve checked the script and it’s fine, trust me :-).
The script checks a load of things and writes a new file into /etc/rsyslog.d/22-loggly.conf so that the syslog messages are sent on to Loggly’s servers. Mine looks something like this:
#          -------------------------------------------------------
#          Syslog Logging Directives for Loggly (scphillips.loggly.com)
#          -------------------------------------------------------

# Define the template used for sending logs to Loggly. Do not change this format.
$template LogglyFormat,"<%pri%>%protocol-version% %timestamp:::date-rfc3339% %HOSTNAME% %app-name% %procid% %msgid% [big-random-token-goes-here-for-authentication@12345] %msg%\n"

# Send messages to Loggly over TCP using the template.
*.*             @@logs-01.loggly.com:514;LogglyFormat

#          -------------------------------------------------------
#          End of Syslog Logging Directives for Loggly
#          -------------------------------------------------------
It then sends a test log message and checks that it gets there (which may take a few tries).
Speedtest
Most people know the http://speedtest.net website as a way of checking the speed of your internet connection. When you use it, it finds a server close to you then measures what is called the “ping” time which is the latency, or how long a message takes to get from your computer to the server, which should be a few to a few tens of milliseconds. Once it has that it downloads some data and then uploads some data, timing how long each takes in “Mbps” (mega-bits per second).
Fortunately for us, Matt Martz has written a Python program to do the same (well similar) speed test using the speedtest.net servers from the command line instead of in a web browser. We can install it from github as so:
There is all the documentation you need on the github page. We are just going to use the --simple argument to get simple output:
Matt points out a few caveats about the tool which are worth reading to determine how much to rely on the data.
Speedtest to Loggly
To get the speed data into Loggly it needs (1) reformatting into JSON (as this is a format Loggly interprets nicely) and (2) sending to Loggly. To do these things, save the following small script as /usr/local/bin/speedtest-loggly:
#!/bin/sh

MSG=`speedtest-cli --simple | perl -pe 's/^(.*): (.*) (.*?)(\/s)?\n/"$1_$3": $2, /m' | cut -d',' -f 1-3`
logger "{\"speed\": {$MSG}}"
Don’t forget to do chmod a+x /usr/local/bin/speedtest-loggly to make it executable. As always, the script also must have Unix line endings, not DOS ones (so use dos2unix on it if you’ve copied and pasted from a Windows machine). Test it out by typing speedtest-loggly: it will take a while to run but should report nothing to the console. If you then do tail /var/log/syslog you should see a new log message on the end of the syslog looking something like:
May 4 13:49:10 raspberry3 pi: {"speed": {"Ping_ms": 38.623, "Download_Mbit": 14.06, "Upload_Mbit": 5.69}}
You can then get it to run every hour by putting a symbolic link to the script from the /etc/cron.hourly directory by doing:
That should all then be working. If you want to understand what’s going on there read on, otherwise jump ahead to Viewing the data in Loggly.
The script explained
We need to reformat the data produced by speedtest-cli --simple into JSON format so that Loggly can display it nicely for us. In long-hand, the data needs to end up looking like:
We are actually going to transform it to look like this but without the spaces and new lines so it will end up as:
This is describing a dataset we are labelling as “speed” and which has 3 parts each with a label and value. As the required format is not so different to the --simple format from speedtest-cli it can be transformed by a perl regular expression and a cut command by the first line of the script:
MSG=`speedtest-cli --simple | perl -pe 's/^(.*): (.*) (.*?)(\/s)?\n/"$1_$3": $2, /m' | cut -d',' -f 1-3`
There are plenty of references to be found regarding regular expressions (including man perlrequick and man perlretut): I’ll just explain what this one is doing. We take the output from the speedtest-cli --simple command and pipe it into (as input) the perl command. The -pe arguments to perl tell it to automatically p -rint what it processes (with an assumed loop over the incoming contents) and to e -xecute the one-line script that follows inline between the single-quotes (see perl --help for a little more detail).
The regular expression (or “regexp”) is a substitution sort (starts with s) and is doing multi-line matching (ends with m) so we can look for the new-line character in the expression. The ^ means it looks for the start of a line, it stores away (indicated by the parentheses) everything up to the : (which is the label) then finds and stores the number, another space and then finds and stores the units with a possible (but ignored) /s which is matched using (\/s)?\n. The \/ is an escaped slash character: without the back-slash first it would be treated specially as ending that part of the regexp. We ignore the /s because that makes the JSON invalid. It then goes on to replace all that it’s found with "$1_$3", a :, space and $2, which is the label an underscore and the units (without any /s) surrounded by double quotes, then a colon, space and the number, then a comma and a space.
Processing the output through perl in this way gives us something like:
This is nearly what we need but we have to get rid of the last comma as it is not valid JSON to include it. To do this we use the cut command: piping the output of perl into cut and getting it to split the input at every comma (the -d',' argument says to use comma as the field delimiter rather than the default tab) and then output just the first 3 fields (using the -f 1-3 argument) which is all of the fields, but as cut knows that’s the end it leaves the comma off!
The first line starts with MSG=` and ends with another so-called back-tick (top left of most keyboards). This is assigning a value to the MSG variable in bash (the shell we are using). You must make sure not to put any spaces either side of the equals sign (even if it does make it human-readable). The back-ticks surrounding the combination of speedtest-cli, perl and cut mean that the pipeline is evaluated and the result set as the value of MSG.
Let’s now look at the second line:
Here we massage the data a little further with the "{\"speed\": {$MSG}}" part. This is adding in {"speed": { to the start and a }} to the end. The double-quotes that we want to add in are escaped with back-slashes so that the shell doesn’t treat them specially and we use double-quotes on the outside to hold it all together and so that $MSG is evaluated (often called “interpolated”). In bash when you assign to a variable you don’t use a dollar sign but when you want to use the variable’s value you put a dollar sign on the front.
Finally, now the message is in JSON format (albeit with no new lines, but that’s fine) we can send it to the syslog with the simple logger command.
The script has used all three types of quote marks:
- single quotes (') to just delimit an argument (i.e. say that what is between the quotes is to be treated as one thing);
- double quotes (") to delimit but also permit variable interpolation (e.g. replacing $MSG with its value);
- back-ticks (`) which are replaced by the evaluated contents of the quotes.
Cron explained
Cron is a scheduling system built into Unix systems. It lets you schedule things to run at regular intervals. The main configuration file can be found in /etc/crontab. The default contents on Debian systems (such as Raspbian) is:
SHELL=/bin/sh
PATH=/usr/local/sbin:/usr/local/bin:/sbin:/bin:/usr/sbin:/usr/bin

# m h dom mon dow user  command
17 *    * * *   root    cd / && run-parts --report /etc/cron.hourly
25 6    * * *   root    test -x /usr/sbin/anacron || ( cd / && run-parts --report /etc/cron.daily )
47 6    * * 7   root    test -x /usr/sbin/anacron || ( cd / && run-parts --report /etc/cron.weekly )
52 6    1 * *   root    test -x /usr/sbin/anacron || ( cd / && run-parts --report /etc/cron.monthly )
This says to run everything in the /etc/cron.hourly directory at 17 minutes past the hour, every hour, run everything in /etc/cron.daily at 06:25 each day and so forth. You can read about it more by typing man 5 crontab. As we just want to run our script once an hour we don’t need to do anything more than link it in with a symbolic link into the cron.hourly directory with the ln -s command described above.
Warning
The main thing to watch out for with linking scripts into these folders is that the scripts are found and executed by the run-parts command which, as you can read in man run-parts, will only run files that have filenames made from the characters a-z, A-Z, 0-9, _ and -. Therefore, if you link in something called myscript.py or script.sh for instance it will not be run.
If you need a more complicated schedule than these defaults then you can just add your own lines to the /etc/crontab file, following the same format.
Viewing the data in Loggly
To view the data in Loggly, take the following steps (note that you have to do this sequence as the interface changes each time you make a click):
- Click on the calendar icon and choose a time range such as the “last day”.
- Click on the “Search” button to load all the entries for the time range.
- Click on “JSON” in the list of the “Field Explorer” to focus on all JSON formatted data.
- Click on the metric you want to chart, such as “Download_Mbit”.
- Click on “Value Of” to plot the values of that metric on a chart.
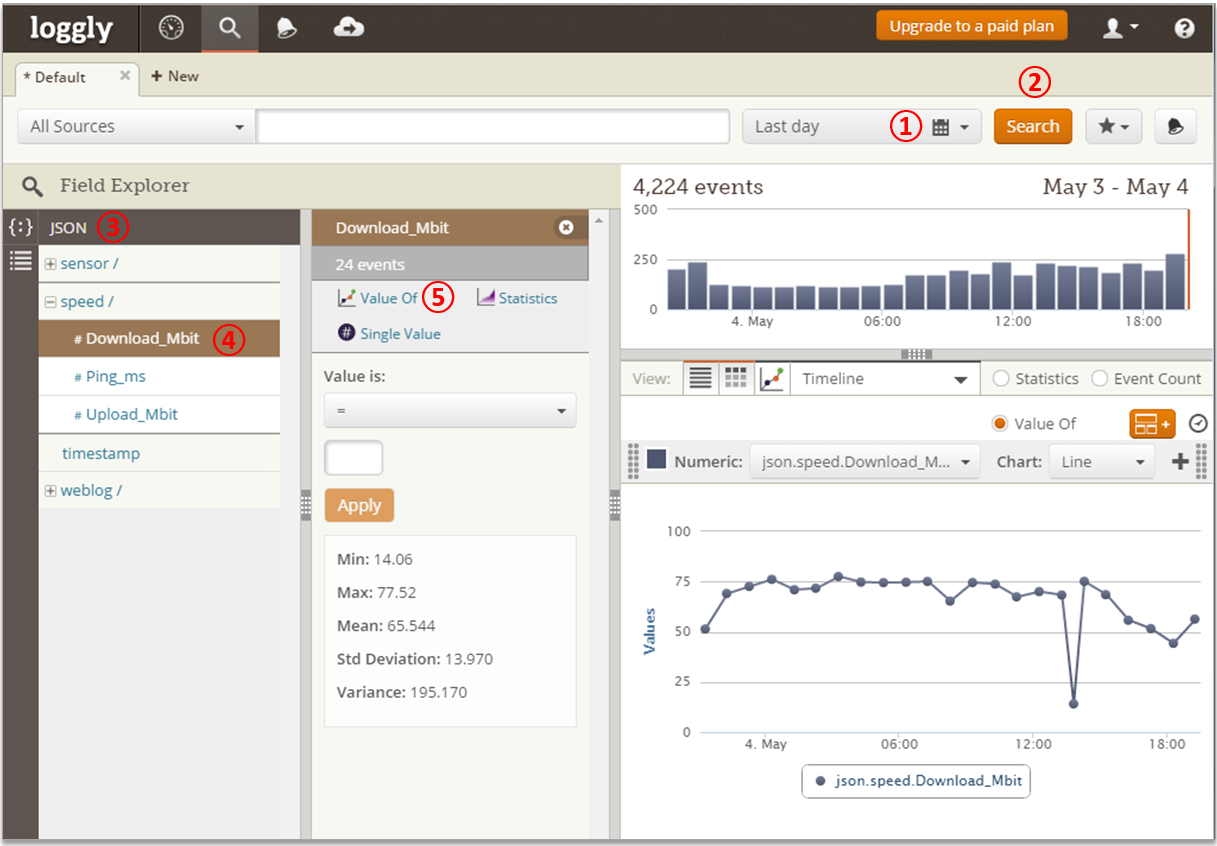
Steps to display the download speed chart in the Loggly dashboard.
You can then hover over the individual points to see the values or take note of the summary statistics shown such as the mean and standard deviation.
There’s lots more to Loggly: it’s worth playing around to find out what it can do.

Comments
Comments powered by Disqus